The New Vehicle Efficiency Standard (NVES) Regulator published the first performance period results on 18 February 2026 for the 2025 reporting year.
The first performance period started on 1 July 2025 and ended on 31 December 2025. This is the only year where the performance period does not cover a full calendar year.
What we publish and why
We are required to publish this information under Section 86 of the New Vehicle Efficiency Standard Act 2024(Opens in a new tab/window) (NVES Act).
This includes:
- interim emissions values (IEVs) for each regulated entity (such as vehicle suppliers, importers or car manufacturers that hold a vehicle type approval) who entered NVES covered vehicles on the Register of Approved Vehicles (RAV) in the 2025 reporting period
- the unit holdings of regulated entities that have an NVES Unit Registry account.
Access to this information provides industry stakeholders and the Australian public information on how the NVES is working. The publication of information about the holding of units also contributes to NVES unit market transparency and allows NVES entities to have access to relevant information to support trading activities.
We have also published aggregated information on overall performance in relation to NVES targets, net position and fleet size and mix, including:
- how many entities met or beat their target
- net position (units allocated versus liabilities accrued, representing potential demand for units)
- total count of covered vehicles for:
- Type 1: New vehicles such as cars, SUVs or light off-road vehicles
- Type 2: New vehicles such as utes, vans or heavy off-road vehicles
- average emissions numbers and targets for Type 1 and Type 2 categories
- average performance of covered vehicles:
- Headline limits are set in legislation. Type 1 and Type 2 vehicles have different headline limits.
- The headline limits are adjusted for the weight of each vehicle to determine the emissions target for each vehicle.
- This means each vehicle has an emissions target that is close to, but may be a little different from, the headline limit.
- The average emissions number represents the total of all vehicles' targets divided by the number of vehicles covered under the NVES for either Type 1 or Type 2 vehicles.
Highlights
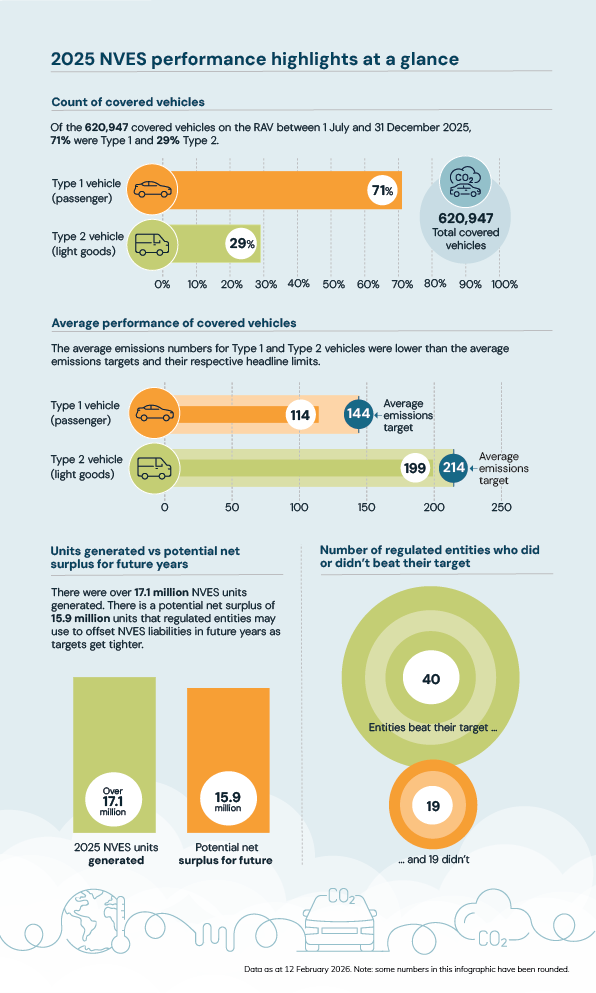
The 2025 NVES performance period included 59 regulated entities who entered a total of 620,947 NVES covered vehicles on the RAV between 1 July and 31 December 2025. Of the 59 regulated entities, 68% beat their target and over 17 million NVES units were generated.
In 2025, NVES data showed that 12% of all covered vehicles were zero-emissions, with 40 entities supplying vehicles in this category. These results indicate the NVES is set to support more low-emissions vehicles on Australian roads, contributing to a reduction of CO2 emissions in future years.
Other 2025 data highlights:
- A total of 40 entities beat their target, generating a combined 17.2 million NVES units.
- After accounting for total NVES liabilities accrued by the remaining 19 entities, there is a potential net surplus of 15.9 million NVES units for use in future years.
- Over two-thirds (71%) of the NVES fleet were classed as Type 1. This primarily comprises light passenger vehicles.
- The remaining covered vehicles (29%) were Type 2 vehicles, this mostly comprised of light goods vehicles as well as off-road passenger vehicles.
- The NVES fleet outperformed its average emissions targets for both Type 1 and Type 2 categories:
- For Type 1, the average CO2 number (114) was lower than the average emissions target (144), and below the headline limit of 141.
- For Type 2, the average CO2 number (199) was lower than the average emissions target (214), and below the headline limit of 210.
Regulated entity interim emissions value data
How to read this tableIf an entity has an interim emissions value (IEV) below zero, this means they have beaten their target. These entities accrue NVES units for the 2025 performance period. If an entity has an IEV above zero, this means they have not beaten their target. These entities accrue NVES liabilities for 2025. |
The below table provides information and data on end of 2025 performance period results for each regulated entity.
Data is as at 1 February 2026.
| Regulated entity | Number of covered vehicles | IEV | Units generated | Liabilities accrued |
|---|---|---|---|---|
| Alfa Romeo SpA | 62 | 2,580 | 0 | 2,580 |
| Anhui Jianghuai Automobile Group Corp., Ltd/ JAC MOTORS | 252 | -2,185 | 2,185 | 0 |
| Aston Martin Lagonda Limited | 105 | 13,877 | 0 | 13,877 |
| Audi AG | 8,050 | -21,780 | 21,780 | 0 |
| Automobili Lamborghini S.P.A. | 67 | -1,594 | 1,594 | 0 |
| B M W AUSTRALIA LTD. | 15,445 | -340,081 | 340,081 | 0 |
| Beiqi Foton Motor Co. Ltd. | 497 | -2,941 | 2,941 | 0 |
| BENTHAM, VINCENT MARK | 2 | 138 | 0 | 138 |
| Bentley Motors Limited | 81 | -1,875 | 1,875 | 0 |
| BYD AUTO CO. LTD | 26,129 | -4,234,294 | 4,234,294 | 0 |
| BYD AUTO INDUSTRY COMPANY LIMITED | 13,474 | -2,048,530 | 2,048,530 | 0 |
| Chery Automobile Co., Ltd | 30,829 | -438,633 | 438,633 | 0 |
| Chongqing Changan Automobile Co., Ltd. | 383 | -65,540 | 65,540 | 0 |
| DONGFENG LIUZHOU MOTOR CO., LTD. | 2 | -291 | 291 | 0 |
| Dr. Ing. h.c. F. Porsche Aktiengesellschaft | 1,653 | 33,448 | 0 | 33,448 |
| FCA USA LLC | 283 | 8,194 | 0 | 8,194 |
| Ferrari S.p.A. | 108 | 15,785 | 0 | 15,785 |
| Ford Motor Company | 355 | -1,079 | 1,079 | 0 |
| FORD MOTOR COMPANY OF AUSTRALIA PTY LTD | 38,541 | -426,261 | 426,261 | 0 |
| Ford Werke GmbH | 1,169 | -24,559 | 24,559 | 0 |
| GAC International Co., Ltd. | 406 | -34,260 | 34,260 | 0 |
| GENERAL MOTORS AUSTRALIA AND NEW ZEALAND PTY LTD | 1,552 | 65,855 | 0 | 65,855 |
| Great Wall Motor Company Limited | 29,660 | -405,198 | 405,198 | 0 |
| Guangzhou Xiaopeng Motors Technology Co. Ltd | 1,000 | -165,995 | 165,995 | 0 |
| Honda Motor Company Limited | 9,022 | 26,069 | 0 | 26,069 |
| Hyundai Motor Company | 39,863 | 84,563 | 0 | 84,563 |
| Isuzu Motors Limited | 29,825 | -365,080 | 365,080 | 0 |
| JAGUAR LAND ROVER AUSTRALIA PTY LTD | 3,355 | 16,666 | 0 | 16,666 |
| JAGUAR LAND ROVER LIMITED | 25 | 1,819 | 0 | 1,819 |
| KG Mobility Corp. | 1,969 | 22,344 | 0 | 22,344 |
| Kia Motors Corporation | 51,732 | -729,698 | 729,698 | 0 |
| MAHINDRA AUTOMOTIVE AUSTRALIA PTY LTD | 2,757 | 32,938 | 0 | 32,938 |
| MASERATI S.P.A. | 96 | 4,496 | 0 | 4,496 |
| Mazda Motor Corporation | 38,465 | 508,517 | 0 | 508,517 |
| McLaren Automotive Ltd | 21 | -416 | 416 | 0 |
| MERCEDES-BENZ AUSTRALIA/PACIFIC PTY LTD | 11,494 | -133,730 | 133,730 | 0 |
| MITSUBISHI MOTORS AUSTRALIA LIMITED | 35,002 | -82,072 | 82,072 | 0 |
| NISSAN MOTOR CO. (AUSTRALIA) PTY. LTD. | 13,877 | 215,261 | 0 | 215,261 |
| Polestar Performance AB | 1,639 | -281,410 | 281,410 | 0 |
| Renault s.a.s | 903 | -16,310 | 16,310 | 0 |
| Rolls-Royce Motor Cars Limited | 34 | 4,497 | 0 | 4,497 |
| SAIC MAXUS Automotive Co., Ltd | 5,519 | 21,129 | 0 | 21,129 |
| SAIC Motor Corporation Limited | 26,991 | -377,601 | 377,601 | 0 |
| SEAT, S.A. | 823 | -67,733 | 67,733 | 0 |
| Shandong Tangjun Ouling Automobile Manufacture Co., Ltd. | 46 | -9,837 | 9,837 | 0 |
| SKODA AUTO a.s. | 2,914 | -86,888 | 86,888 | 0 |
| Smart Automobile Co., Ltd. | 2 | -303 | 303 | 0 |
| STELLANTIS (AUSTRALIA AND NEW ZEALAND) PTY LTD | 336 | -50,466 | 50,466 | 0 |
| Stellantis Auto SAS | 681 | -23,730 | 23,730 | 0 |
| STELLANTIS EUROPE S.P.A | 158 | -9,615 | 9,615 | 0 |
| Subaru Corporation | 13,187 | 139,635 | 0 | 139,635 |
| Suzuki Motor Corporation | 5,042 | -64,204 | 64,204 | 0 |
| Tesla, Inc. | 13,907 | -2,212,093 | 2,212,093 | 0 |
| TOYOTA MOTOR CORPORATION AUSTRALIA LIMITED | 115,504 | -2,890,625 | 2,890,625 | 0 |
| Volkswagen AG | 15,876 | -510,249 | 510,249 | 0 |
| Volvo Car Corporation | 3,643 | -158,781 | 158,781 | 0 |
| Wuhan Lotus Cars Co., Ltd. | 1 | -173 | 173 | 0 |
| Zheijiang Zeekr Intelligent Technology Co., Ltd | 1,503 | -259,440 | 259,440 | 0 |
| Zhejiang Geely Automobile Co., Ltd. | 4,630 | -620,233 | 620,233 | 0 |
| Total | 620,947 | -15,942,972 | 17,165,783 | 1,222,811 |
Downloadable version of the data table
2025 regulated entity interim emissions value data (Excel 48 KB).
NVES unit holdings data
How to read this tableThe below table provides information and data on current NVES unit holdings for each regulated entity that has opened an NVES registry account. Please note that regulated entities have 12 months from IEV issuance to apply for a unit registry account and have any 2025 units issued. The table below will be updated periodically to reflect this. |
Data is as at 13 March 2026.
| Regulated entity name | NVES unit holdings |
|---|---|
| Aston Martin Lagonda Limited | 0 |
| Audi AG | 21,780 |
| Beiqi Foton Motor Co. Ltd. | 2,941 |
| BYD AUTO CO. LTD | 4,234,294 |
| BYD AUTO INDUSTRY COMPANY LIMITED | 2,048,530 |
| Chery Automobile Co., Ltd | 438,633 |
| Dr. Ing. h.c. F. Porsche Aktiengesellschaft | 0 |
| Ferrari S.p.A. | 0 |
| Great Wall Motor Company Limited | 405,198 |
| Guangzhou Xiaopeng Motors Technology Co. Ltd | 165,995 |
| Isuzu Motors Limited | 365,080 |
| MASERATI S.P.A. | 0 |
| Mazda Motor Corporation | 0 |
| MERCEDES-BENZ AUSTRALIA/PACIFIC PTY LTD | 133,730 |
| MITSUBISHI MOTORS AUSTRALIA LIMITED | 82,072 |
| NISSAN MOTOR CO. (AUSTRALIA) PTY. LTD. | 0 |
| Polestar Performance AB | 281,410 |
| SAIC MAXUS Automotive Co., Ltd | 0 |
| SEAT, S.A. | 67,733 |
| SKODA AUTO a.s. | 86,888 |
| Tesla, Inc. | 2,212,093 |
| Volkswagen AG | 510,249 |
Downloadable version of the data table
2025 NVES unit holdings data (Excel 47 KB).
Notes for the 2025 publication
- Some numbers under highlights and in the infographic have been rounded.
- The NVES Regulator may periodically republish unit holdings data to reflect the most up-to-date information available and as required by the NVES Act.
- The NVES Regulator takes all reasonable efforts to ensure the information published on its website is accurate at the time of publication.